ESPC House Price Report - June 2012
- The average house price in Edinburgh rose by 3.1% annually in the second quarter of 2012 and now stands at £226,367.
- There are more homes selling than at this stage last year. Second quarter sales were up by 9.7% annually.
- Movements in price varied within the Capital, with the City Centre seeing a rise whilst areas such as Stockbridge and Comely Bank saw a decline in house values.
- The average house price in East Lothian rose by 0.4% annually to £226,892.
- Midlothian, West Lothian and Dunfermline all saw house prices rise by between 7 and 10% annually. In each case these rises offset falls observed during the same period last year.
- Most buyers are enjoying some success in negotiations with sellers with properties selling for an average of 3.6% below valuation.
- Though there is likely to be some fluctuation in values from month to month, prices are expected to remain broadly unchanged over the second half of 2012.
Latest figures from ESPC - the leading property marketing firm in Edinburgh, the Lothians and Fife - reveal house prices in Edinburgh rose by 3.1% annually during the second quarter of 2012. The rise means the average price of a property in the Capital now stands at £226,367 - up from £219,530 last year. The number of homes sold was also ahead of levels seen last year with completed sales up by 9.7% compared to the second quarter of 2011.
Midlothian and West Lothian both saw a sharp increase in the average house price with year-on-year rises of 9.9% and 7.8% respectively. These rises largely offset similar declines seen last year meaning that in both cases prices have now been brought back up toward levels seen in 2010.
Commenting on the results David Marshall, business analyst with ESPC, said: "We've seen a fairly consistent pattern so far this year with the number of homes selling higher than in previous years. Although some areas have seen prices move upwards, rises this year are generally offsetting fall last year meaning that in most cases the average house price is heading back to the sort of levels we saw at the start of 2010.
"Despite the increase in the number of sales this year, there are still more people looking to sell than there are in a position to buy meaning that competition amongst sellers is still high. In most cases sellers are accepting offers below Home Report valuation to secure a sale, with properties selling for an average of just over 3% below their valuation.
"Looking ahead we don't expect much change in the market in the second half of the year. The number of homes selling should be higher than we saw last year but still some way below the sort of levels you'd have seen prior to the credit crunch. There may be some volatility in average house prices from month to month but overall there is unlikely to be a prolonged shift in prices in either direction."
Edinburgh
The average house price in Edinburgh during the second quarter of 2012 was £226,367 - up 3.1% from £219,530 a year ago. The number of homes sold in the Capital also rose with sales recorded in the three months to June up 9.7% compared to Q2 2011.
David Marshall said: "Early in 2012 we saw a notable rise in the number of homes selling and this trend has continued over the last three months. It's important to note of course that this improvement does come from a low base however and sales are still around 40% below what would have been considered 'normal' levels prior to the credit crunch.
"Within the City there was a mixed picture for house prices with some areas such as the City Centre and Leith observing rises while the average price in other areas like Stockbridge and Comely Bank fell sharply. You can often see this sort of volatility in more localised figures - particularly with sales still being relatively low - and in each case we'd expect to see these figures settle down in coming months.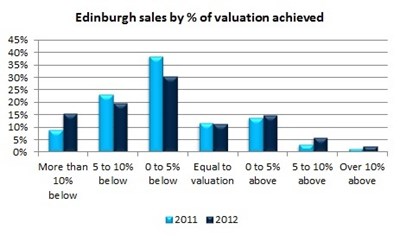
"Overall we saw a slightly higher percentage of properties achieve their Home Report valuation during the second quarter this year. 34.3% of properties sold over the last three months achieved their valuation - up from 29.6% a year ago. Interestingly however there was a rise in the proportion of homes secured for more than 10% below their valuation. 15.5% of properties were secured at this level compared to just 8.7% last year. In most cases these were properties which had been on the market for a long period of time where sellers had to accept a lower offer to secure their sale."
Lothians
There was little movement in the average house price in East Lothian during the second quarter of the year. An annual rise of just 0.4% meant the average house price in the area inched up from £226,053 to £226,892.
Sharper increases were recorded in Midlothian and West Lothian. West Lothian saw a year-on-year rise of 7.8%, bringing the average house price in the area to £163,521 whilst in Midlothian a 9.9% annual rise means that the average selling price of a property in the region now stands at £177,278.
David Marshall explained: "Although we've seen sharper rises in Midlothian and West Lothian it's always important to look at results in context. At this stage last year we saw prices in both of these areas decline meaning that actually all we're seeing here is prices returning to the sort of levels we saw in 2010."
Dunfermline
The average house price in Dunfermline rose by 9.4% to £138,923 annually during the second quarter of 2012. As was the case in Midlothian and West Lothian, the increase came on the back of a similar fall during the same period a year ago meaning that the average has simply moved back towards 2010 levels.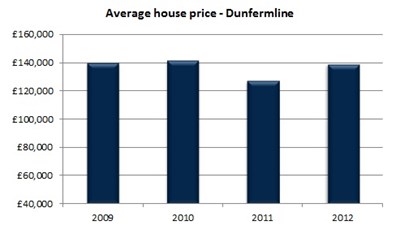
David Marshall said: "The average house price in Dunfermline dipped in the second quarter last year but has picked up again in 2012 and is now back in line with the sort of levels we saw in 2009 and 2010. As is the case across the country competition amongst sellers is high meaning that in most cases people are accepting offers slightly below home report valuation in order to secure a sale."
Got a question? Read our House Price Report FAQs.
Want to know about previous months and years? Read our historical house price data.